catworkx Connector for Graphite, InfluxDB and JMX for Jira
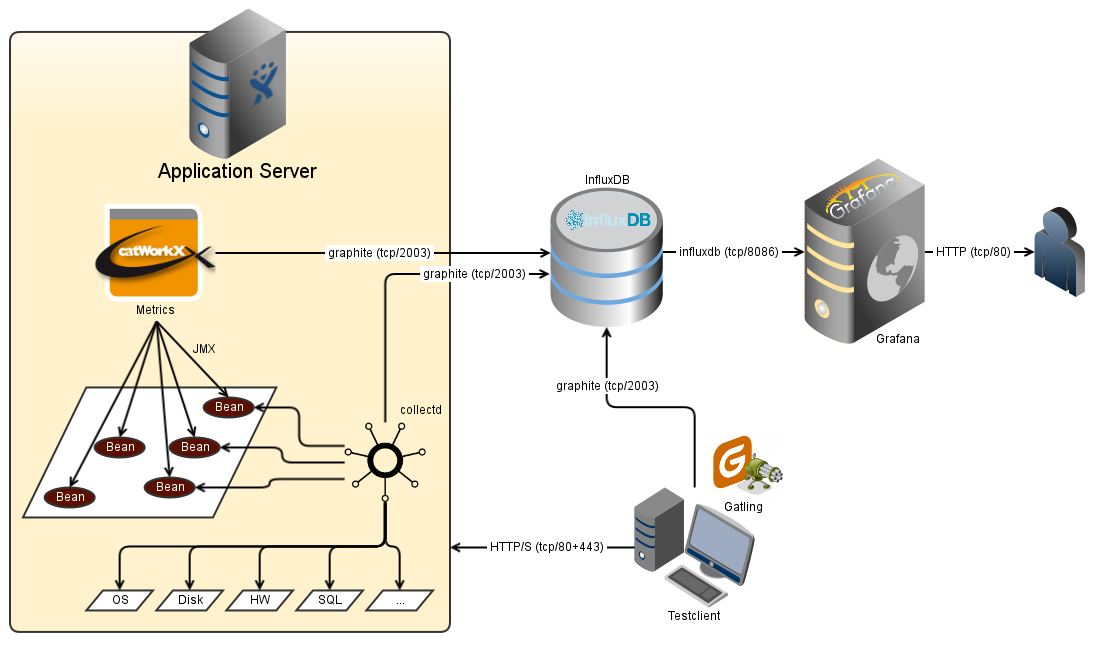
With catworkx Connector for Graphite, InfluxDB and JMX for Jira (also called Metrics) you can collect and store health information of your Jira system in an influxDB database. Therefor you Metrics provides:
- JMX (Java Management eXtensions) protocol
- graphite backend
- influx backend
Using the JMX interface (Java Management eXtensions), you can monitor the status of your Jira server in real time. This will provide you with useful data such as the resource usage of your instance and its database latency, allowing you to diagnose problems or performance issues. To read the JMX data, you will need to use a JMX client like jconsole, jvisualvm, jmc or collectd (recommended).
Beside the Jira health information, you also can use collectd to collect health information of your operating system, hardware, database etc. collectd can filter all the collected information before it writes the filtered information into the influxDB database.
catworkx Connector for Graphite, InfluxDB and JMX also supports the graphite (recommended) and influx protocol to write all Jira health information directly into the influxDB database.
To present the stored information from the influxDB database, you may use Grafana or any equivalent tools to display the stored data.
To test your system's performance, you can create some workload by an external testclient using Gatling.
>> Get Support <<
App Details
| Supported Languages | EN |
|---|---|
| Current Version | 8.0.4.11 |
Filename Pattern |
|

